Machine Learning
To view the complete code of the ML : click here
Machine learning (ML) is a type of artificial intelligence (AI) that allows software applications to become more accurate at predicting outcomes without being explicitly programmed to do so. Machine learning algorithms use historical data as input to predict new output values.Machine learning is important because it gives enterprises a view of trends in customer behavior and business operational patterns, as well as supports the development of new products. Many of today's leading companies, such as Facebook, Google and Uber, make machine learning a central part of their operations. Machine learning has become a significant competitive differentiator for many companies.
Using machine learning algorithms for big data analytics is a logical step for companies looking to maximize their data's potential value. Machine learning tools use data-driven algorithms and statistical models to analyze data sets and then draw inferences from identified patterns or make predictions based on them. The algorithms learn from the data as they run against it, as opposed to traditional rules-based analytics systems that follow explicit instructions..

Analysis Report
In the Executive Summary, the ml thought process was summarized in a non-technical format. In this section, the technical aspects are explained in a detailed fashion: the steps taken and the reasoning behind every decision. As mentioned in the Summary, this subreddit consists of 18million+ rows so the concepts of big data are applied to leverage the data. The data for this analysis is picked up from the last transformation performed in nlp.
Score Prediction
We tried to answer the business question (predicting the score of a comment) using different features such as sentiment, controversiality,total_awards_received,comment_length and hour.
Before starting to build any model, ML transformations are some necessary steps that are supposed to be performed. All the categorical variables are checked for unusual values. The data is split into train-test dataset with 80% values in train dataset. The hour and sentiment variable are the only string type variable and hence transformations like stringindexer and onehot encoding are staged on it. All the features or predicting variables are gathered under one column using vector assembler.
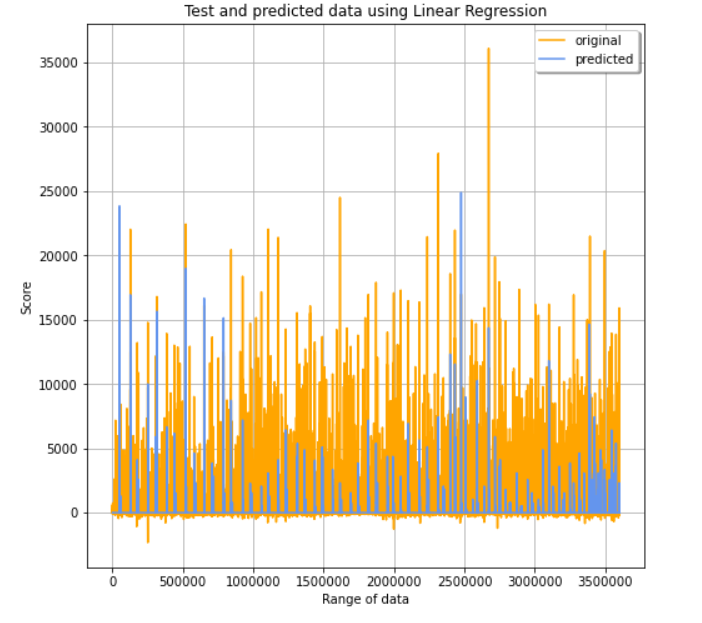
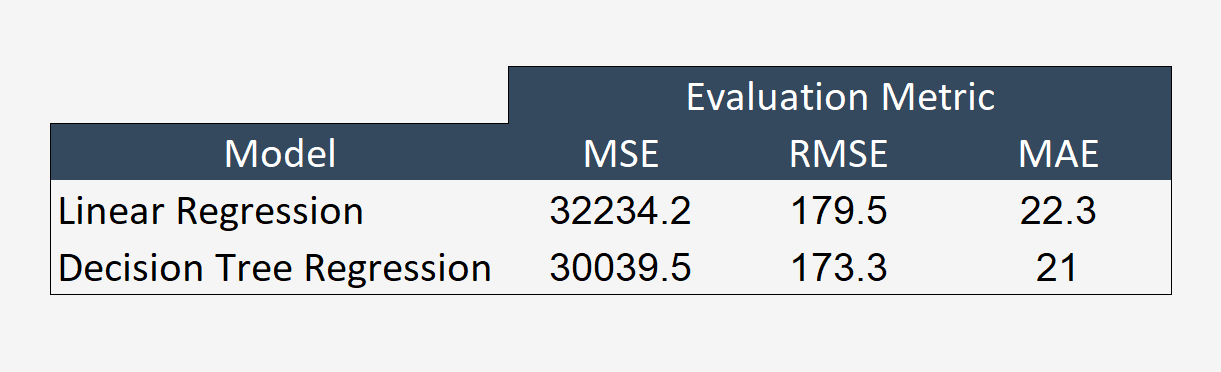
Linear Regression
We first tried the linear regression model as it is a basic regression problem. The pipeline is created with all the stages (stringindexer,onehotencoder,vectorassembler and the linear regression model). 3-fold crossvalidation is applied to find the best hyperparameters for the model.The different parameter applied are regParam, elasticNetParam and maxIter.The model is fit on the train data and transformed on the test data to check.The table with all the evaluation metrics of the model is attached below.
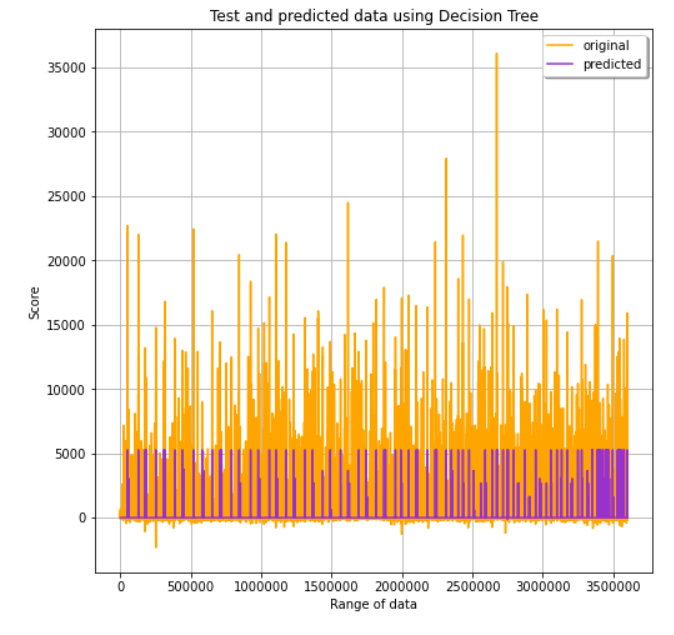
Decision Tree
Next we tried the decision tree model. The pipeline is created with all the stages (stringindexer,onehotencoder,vectorassembler and the decision tree model). 3-fold crossvalidation is applied to find the best hyperparameters for the model.The different parameter applied are maxDepth and maxBins.The model is fit on the train data and transformed on the test data to check.The table with all the evaluation metrics of the model is attached below.
The evaluation metrics for each model is tabulated
Controversiality Prediction
We tried to answer the business question (predicting the controversiality of a comment) using different features such as author_premium,locked, no_follow, stickied,total_awards_received,comment_length,hour and score.
Before starting to build any model, ML transformations are some necessary steps that are supposed to be performed. All the categorical variables are checked for unusual values. The main target variable is checked for balance. It is found that the data is highly imbalanced, hence downsampling is necessary. After downsampling, each category in controversiality (0,1) has around 700K values.
The data is split into train-test dataset with 80% values in train dataset. The hour variable is the only string type variable and hence transformations like stringindexer and onehot encoding are staged on it. All the features or predicting variables are gathered under one column using vector assembler.
Logistic Regression
We first tried the logistic regression model as it is a binary classification problem. The pipeline is created with all the stages (stringindexer,onehotencoder,vectorassembler and the logistic regression model). 3-fold crossvalidation is applied to find the best hyperparameters for the model.The different parameter applied are regParam, elasticNetParam and maxIter.The model is fit on the train data and transformed on the test data to check. The accuracy of this model is 63%.
Random Forest
The next model that we tried was a ensemble method of decision tree which is random forest. The pipeline is created with all the stages (stringindexer,onehotencoder,vectorassembler and the random forest model). 3-fold crossvalidation is applied to find the best hyperparameters for the model.The different parameter applied are maxDepth, maxBins and numTrees.The model is fit on the train data and transformed on the test data to check. The accuracy of this model is 55%.
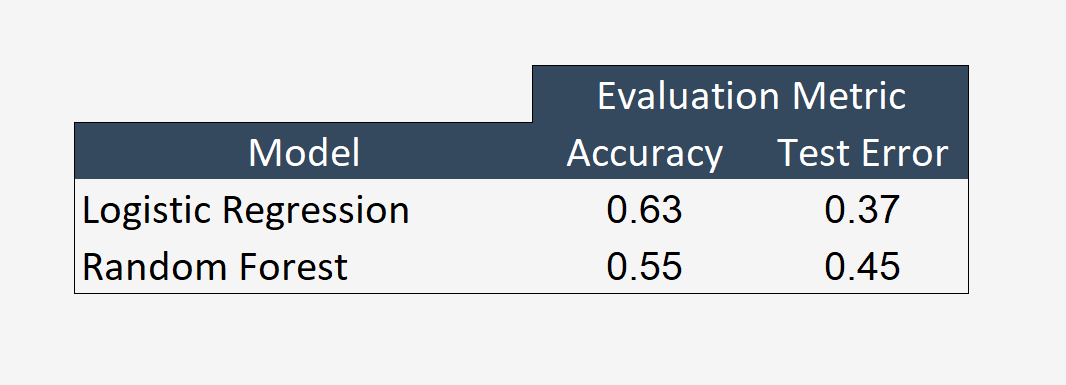
The accuracy of both the models is not that great and can be improved by trying different models or shuffling feature variables.
ROC Curve
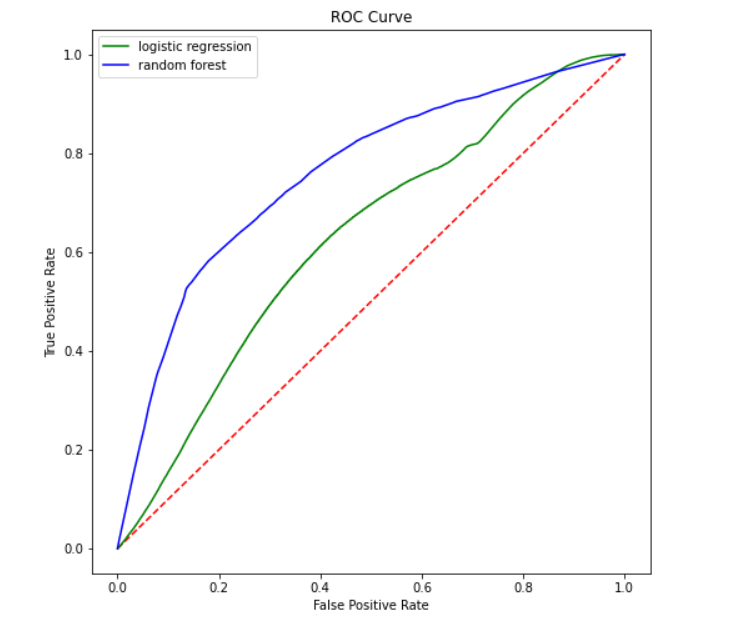
ROC curves are frequently used to show in a graphical way the connection/trade-off between clinical sensitivity and specificity for every possible cut-off for a test or a combination of tests. In addition the area under the ROC curve gives an idea about the benefit of using the test(s) in question.An ROC curve (receiver operating characteristic curve) is a graph showing the performance of a classification model at all classification thresholds. This curve plots two parameters:
- False Positive Rate
Reference : Tech Target