Exploratory Data Analysis
To view the complete code of the EDA : click here
Exploratory Data Analysis refers to the critical process of performing initial investigations on data so as to discover patterns,to spot anomalies,to test hypothesis and to check assumptions with the help of summary statistics and graphical representations.It is a good practice to understand the data first and try to gather as many insights from it. EDA is all about making sense of data in hand,before getting them dirty with it.
EDA is a necessary step to understand the data and explore the variables before deep-diving into the analysis. Some basic graphs were plotted to understand the Reddit data and look at the patterns and abnormalities.

Analysis Report
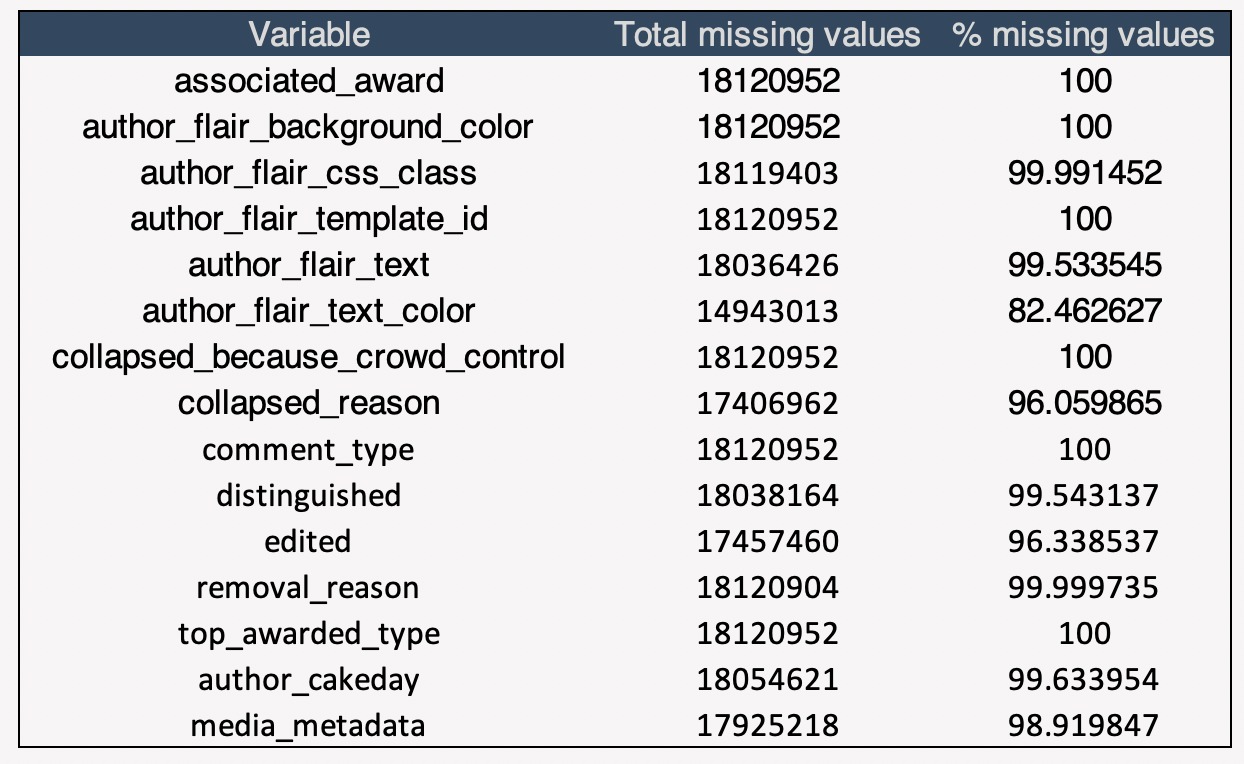
In the Executive Summary, the eda was summarized in a non-technical format. In this section, the technical aspects are explained in a detailed fashion: the steps taken and the reasoning behind every decision. As mentioned in the Summary, this subreddit consists of 18million+ rows so the concepts of big data are applied to leverage the data. In this subreddit dataset, there are 18120952 rows and 51 columns to be precise. It is necessary to perform some intermediary data quality checks.
By performing a simple missing value check, it was found out that some of the columns had more than 70% missing/blank values. Such columns were directly dropped as it will not help in the analysis in anyway. This helps in reducing the number of columns as performing a subset on the data is important as it is not feasible to analysis every feature of a dataset. After dropping the almost empty columns, 36 data rich columns are left.
After dropping the missing columns, the next step is to perform data transformations to help build interesting graphs and answer the business questions related to EDA. New columns are added, the date format is converted from utc, regex is used to extract and convert the values. It is easier to create summary tables and graphs after performing needed transformations.
Moving on, the first business question that is tried to answer is the relationship between the comment score and length. The length of the column (number of characters) is calculated and compared with the average score of comments for that length. From the data it can be seen that there are few lengths of the comments for which the average score is greater than 2000. Hence a subset of the dataset can be created to have a better understanding. The relationship between the two variables is very unstable. Comparatively, the average score is low if the length of comment is small. The maximum peak of the score is reached as the length increases. If the author is aiming to increase the score, the target should be to keep the character count more than 3000+. In this subreddit, there are no comments with the length greater than 10,000, hence there can be no conclusions for that section.
Moving on, there are some basic questions related to the authors of the comments that needs to be answered. The first question that pops up in mind is the top 10 authors with highest frequency of the comments. The total number of comments of each author is calculated. There are 1438703 authors in total. This graph depicts the top 10 authors with the highest frequency of comments over the timeframe. The most active user is a-mirror-bot. Through the course of 2years, he has 66720 comments in total.
Now we have the top 10 most active authors of the subreddit, moving on the next question is to check if these Top 10 authors are controversial. The user with the highest number of comments is a-mirror-bot but from this graph he is not the user with the highest controversiality. This implies that being active or having more comments does not make you prone to being tagged as controversial. CantStopPopping is one of the lowest active user among the top 10 but still he has the most controversiality.
Now since we have the most active author, we can look at the Relationship between his Score and his Total Awards. The total number of awards for each comment is calculated. From the graph, it can be seen that even the most active user is not able to pull maximum awards. Even if the score of the comments increases, the number of awards does not increase and is still consistently zero.
Next the analysis is progressed towards looking at the Relationship between Time of the day and number of comments. The total number of comments for each hour of the day is calculated. This analysis is helpful in finding the ideal timeframe when the redditers of this Subreddit are active. The timeframe with the highest activity (hottest comment time) is between 3pm and 7pm. The reddit users are very active during these hours. As the night progresses, the number of comments dip and the lowest point is around 9-10am, this is the time when people generally wake up and hence they are not active on reddit that much.
Now we looked at the time of the day, Moving further to get a bigger picture, we will look through the number of comments for each month of the timeframe of our data (2019/07 - 2021/06). The total number of comments for each month is calculated. In the beginning of the time period in the graph, the number of comments is consistent and around 400K. There is a spike in the frequency of comments after March 2020, this is the exact time when covid hit. This spike makes sense as people were clueless regarding the situation and freaking out and must have found Reddit the perfect platform to vent out their emotions as the redditers are anonymous. This must have been the perfect platform to look past the whole situation and have a space to share comments/views. The comments drastically decrease, after October 2020, the comments are again following a steady path, but it is still greater than pre-Covid era. This might be the case as the Reddit users might have increased.
External Dataset
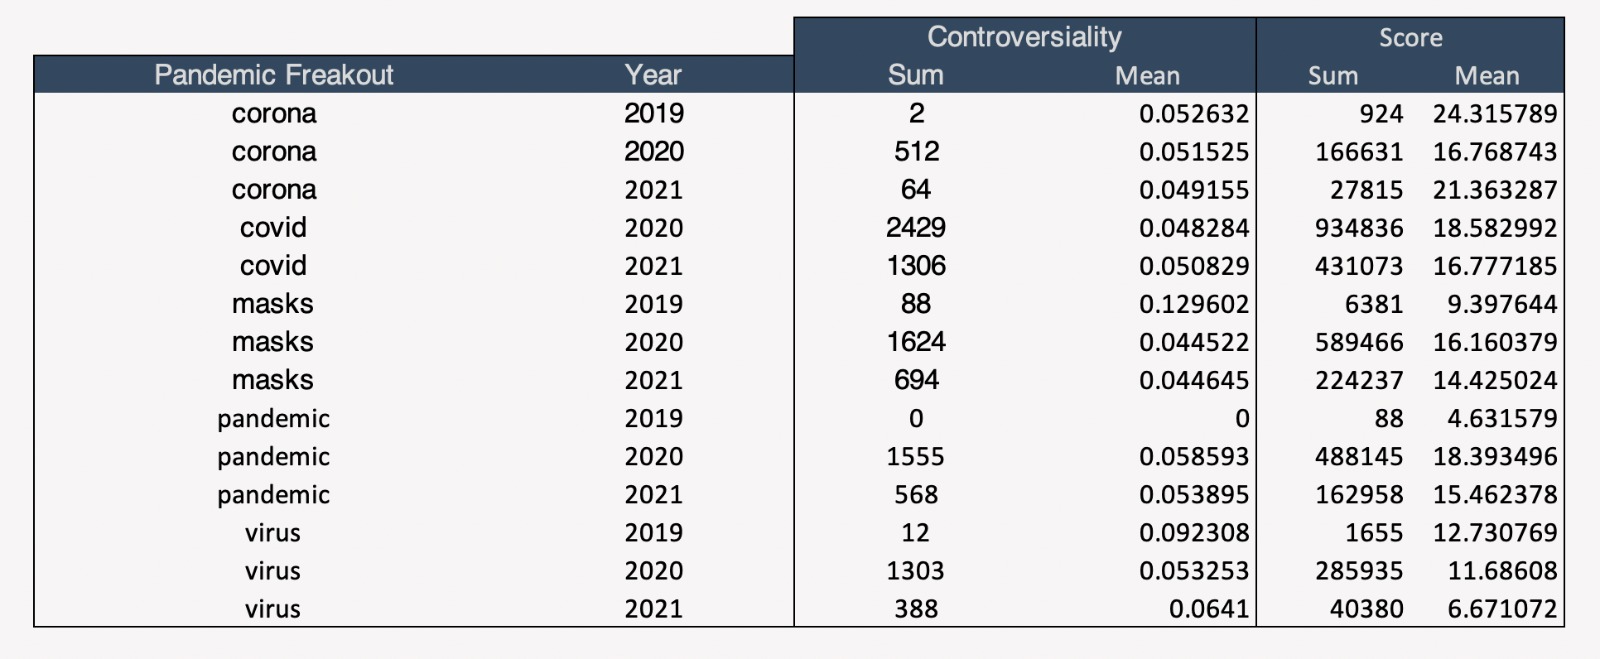
Since there is a spike in the Number of comments around the time when covid hit, it seems fit to encorporate an addtional dataset to check if there is any further relationship. The new data set revolves around the total number of covid cases around the world and the daily update. Regex searches is implemented on the main data set to pull out the information of specific keywords of interest to find out the relation.
Reference : Towards Data Science